We’ve missed the real story with this paper on the Pfizer vax
A creepy study
I’m going to talk about a creepy paper that came out a few months ago:
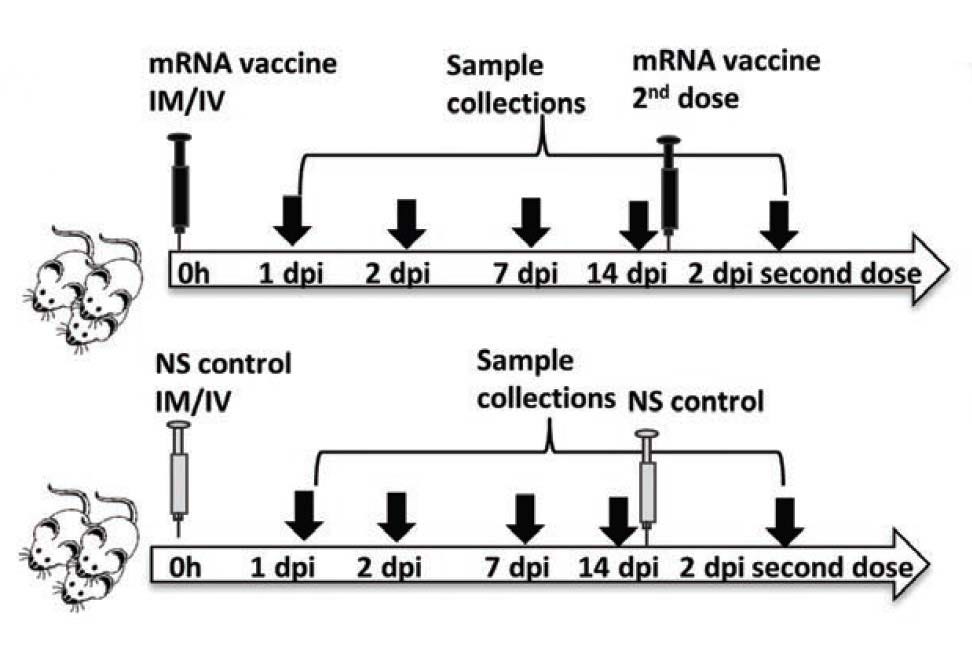
In this paper, mice were injected either intravenously (IV) or intramuscularly (IM) with the Pfizer (BNT162b2) mRNA COVID-19 vaccine, and compared to controls injected with normal saline (NS).
Necropsies were performed at 1, 2, 7, and 14 days post injection (dpi).
A group of mice received a second boosting dose 14 days after the first dose and were examined at 2 dpi (days post injection) after boosting.
If you only read the abstract and descriptions of the data, you might come away thinking that IV injections of the vaccine were pretty bad and led to all kinds of heart and liver pathologies, but IM (intramuscular) injections were more-or-less ok, and only led to mild issues. This would be comforting for anyone considering getting vaccinated, since the vaccines are supposed to be injected intramuscularly.
But the problem is that the data shows that IM injection also looked bad, and for some reason, the authors glossed over that in their discussions.
A necropsy of the paper
There were a lot of irregularities with this paper. I’ll split them up into three groups: “Egregious,” “Shifty,” and “Odd.”
Egregious
Nowhere in the paper do the authors reveal the total number (n) of mice for all the treatments and time points. This is the entirety of the Methods section:
It’s unclear how many mice were used for the IV vs IM vs control groups. This information is also not in the supplementary material. How is this possible? I read this paper multiple times- maybe I missed this information somehow. If I missed this and you happen to find it, please contact me.
The only mention of any numbers of mice are in Table 1 (which doesn’t include all the time points), and the n (number of mice) between IV, IM, and NS groups are all over the place. Why?
In particular look at the first column and fourth column, which are for the first IV dose 2 dpi (2 days post injection) and second IV dose 2 dpi, respectively. The n for the first IV dose was 13. The n for the second IV dose was 9.
Was it that they started with 22 mice (13+9) that they had planned to inject via IV, and decided that for the first batch of necropsies (after the 1st dose), they would look at 13 mice (why 13?) and for the second batch of necropsies (after the 2nd dose), they decided to look at the remaining 9?
It’s strange to use these numbers, and stranger still that there was no discussion of it anywhere.
Ok I’ll say it. I couldn’t help but wonder: did they actually start with the same number of mice for both batches of necropsies (first IV dose and second IV dose) but some died, and weren’t included in the analysis? They didn’t mention anywhere in the paper that any mice died, but they didn’t mention that mice didn’t die either.
Oh and when I say “died” here I mean that mice died prematurely, before they were killed by the researchers for the purpose of performing necropsies on them.
I’ve reached out to the corresponding author about this question. I’ll post an update if I hear back.
Perhaps I’m just being paranoid and morbid. Perhaps they just decided randomly to study 13 mice for the first IV dose and 9 mice for the second IV dose.
Shifty
It’s unclear whether all the data we are looking at in Table 1 are from female mice.
Let’s look at the Methods again. In the first sentence it says they used female mice, but then later in that section they say, “another group of male mice was subsequently tested by the same protocol after preliminary positive results.”
I’m guessing that what we see in Table 1 is just from female mice though, because of what I see here:
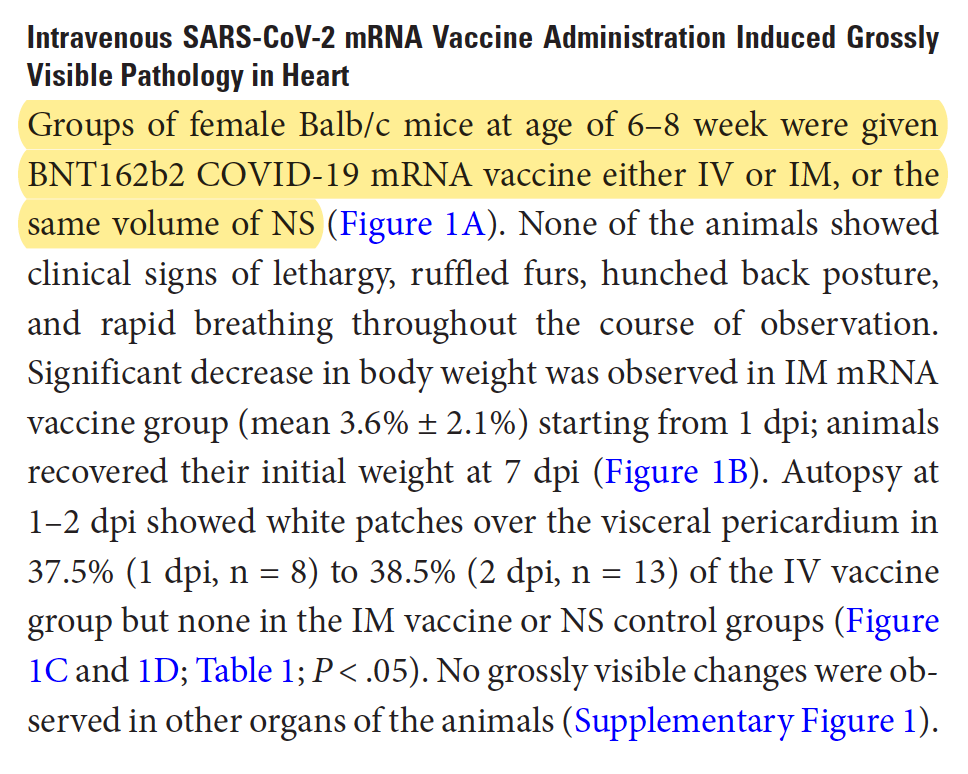
“Groups of female Balb/c mice at age of 6-8 week were given BNT162b2 COVID-19 mRNA vaccine either IV or IM, or the same volume of NS…”
Then when you look later in that paragraph where they state the incidence rate of white patches over the visceral pericardium at 2 dpi (n=13) for the IV vaccine group, it says 38.5%, which matches what is in Table 1 (first column).
So this is what makes me think that Table 1 only shows female mice.
I wish they didn’t have to make it so hard to figure out what was going on.
Now if we believe that Table 1 is just from female mice, this should make us pause because, as we now know, males have higher rates of heart inflammatory problems from these vaccines compared to females. What would the rates have looked like if we had included males? Better yet would have been to see the incidences separated by sex.
Later in the Discussion they write:
“Although our male mice had similar degree of myopericarditis to female mice…”
We just have to take them for their word when they say there was a “similar degree” of myopericarditis to the female mice, since they don’t actually present the data on the males.
The only place where we see any data for the males is in the supplementary materials, and even then they only show cytokine mRNA expression profiles. Aside from that, there are three heart tissue images taken from males in the supplementary materials, all from the IV injected group (none from the IM group).
There are no numbers for white patches over the visceral pericardium, or pericardial calcific deposits, or cardiomyocytes necrosis, etc.
Let’s now look at a part of the Results section which I will call the “IM Injection is A-OK, Nothing to Worry About Here Folks” section:
If you read this you’d be confused, because weren’t there some instances of Bad Things in the IM injected mice? Here are the bad things, in that same table we’ve been looking at, aka the only table of data in the paper:
So actually, those things get covered later in the Results in a separate section, where they are lumped in with the results of the mice at 7 dpi and 14 dpi. In fact this seems to be the only place where there is a discussion of the IM injected mice at 7 dpi or 14 dpi. Here’s the entire section:
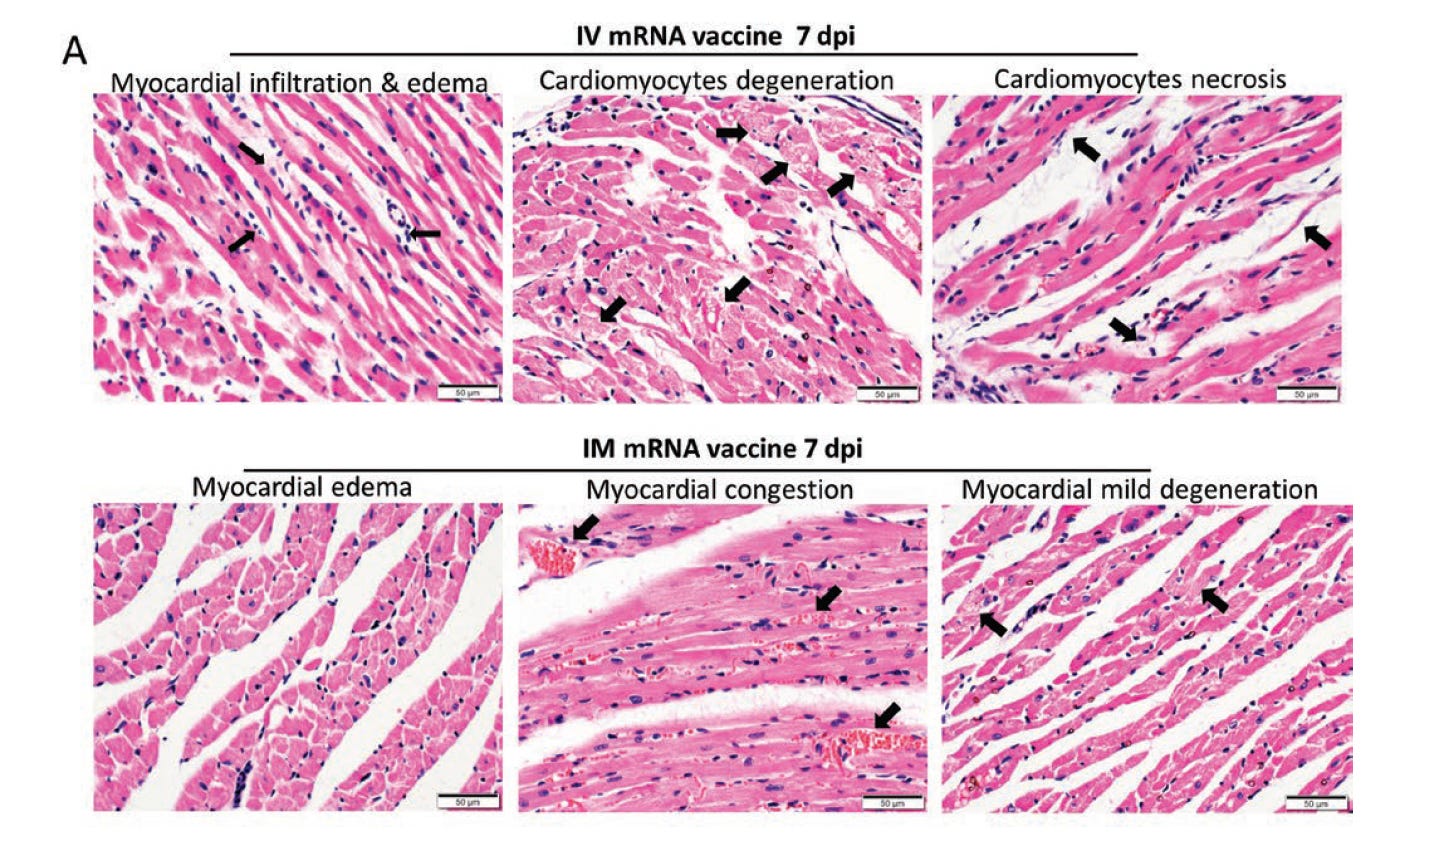
None of the data for the 7 dpi or 14 dpi timepoints were included in this paper (not even in the supplementary materials). Some representative images were included, however:
I’m not a cardiologist so these images don’t mean much to me. It was mentioned that in the IM group they “only showed vascular congestion, myocardial edema, and occasional foci of cardiomyocyte degeneration.” I don’t know to what degree seeing “only” these pathologies affects one’s chances of developing heart issues later in life. I’ll leave that to the cardiologists to debate.
Also in the second paragraph where they mention “IM/IV and IV/IM,” I’m pretty sure those are typos. “IM/IV” and “IV/IM” are not defined anywhere and the only thing that makes sense here and matches with the data in the table is to say that they meant to say “IV and IM” there.
So they mean to say the incidence of grossly visible white patches over the visceral pericardium was 3/9 for the IV group and 1/6 in the IM group.
The rest of that last column in Table 1, you know, where we see 2/6 occurrence of pericardial calcific deposit, 2/6 pericardial WBC infiltration, 6/6 myocardial WBC infiltration, 6/6 cardiomyocytes degeneration, 6/6 cardiomyocytes necrosis, is summarized by the following sentence:
“Both groups showed more diffuse and severe changes of myopericarditis with foci of mild myocardial hemorrhage, which affected both the right and left heart.”
There were a few other things that were “shifty.”
The Abstract mostly left out anything bad that was seen in the IM group except to say that IM injection led to “weight loss and higher serum cytokine/chemokine levels,” and this:
“The histological changes of myopericarditis after the first IV-priming dose persisted for 2 weeks and were markedly aggravated by a second IM- or IV-booster dose.”
By the way this makes it sound like they gave an IV dose to some mice and then boosted some of those with a second IM dose and boosted others with a second IV dose. But I haven’t found anything in the methods or supplementary material to indicate that is what they did.
My assumption, based on trying to decrypt their methods, is that of the mice that got an IV dose, some got a second IV dose, and of the mice that got an IM dose, some got a second IM dose. There isn’t anything in the methods that says that they mixed up the type of injection (IV or IM). That would have been an odd thing to do. If you see something in this paper to indicate that I’m wrong about their methods, please let me know.
Towards the end of the Abstract they said “Ballooning degeneration of hepatocytes was consistently found in the IV group” (hepatocytes are a type of liver cell). It didn’t mention seeing this in the IM group.
Now maybe this pathology wasn’t “consistently” found in the IM group, but it occurred in 3/6 cases after the first IM dose:
Oh by the way, when you look at Fig 8A which is supposed to show some representative images of liver sections, you only see images from the control or IV groups. No image for the IM group.
There were other things like this, where it just felt like the text of the abstract, results, and discussion sections were obfuscating.
Ideally in a scientific paper, the discussion is there to enhance your interpretation of the data. While reading this paper, I felt as though the discussion was there to hinder my seeing the data.
Odd
Figure 6 shows fold change of cytokine mRNA expression levels in the IV and IM cases.
Cytokines are small proteins that signal the immune system. High levels of certain cytokines are associated with inflammation.
In the 1 dpi timepoint some of the fold changes of cytokine expression were higher in the IM group vs the IV group. Some might consider this counterintuitive, yet there isn’t much discussion of it.
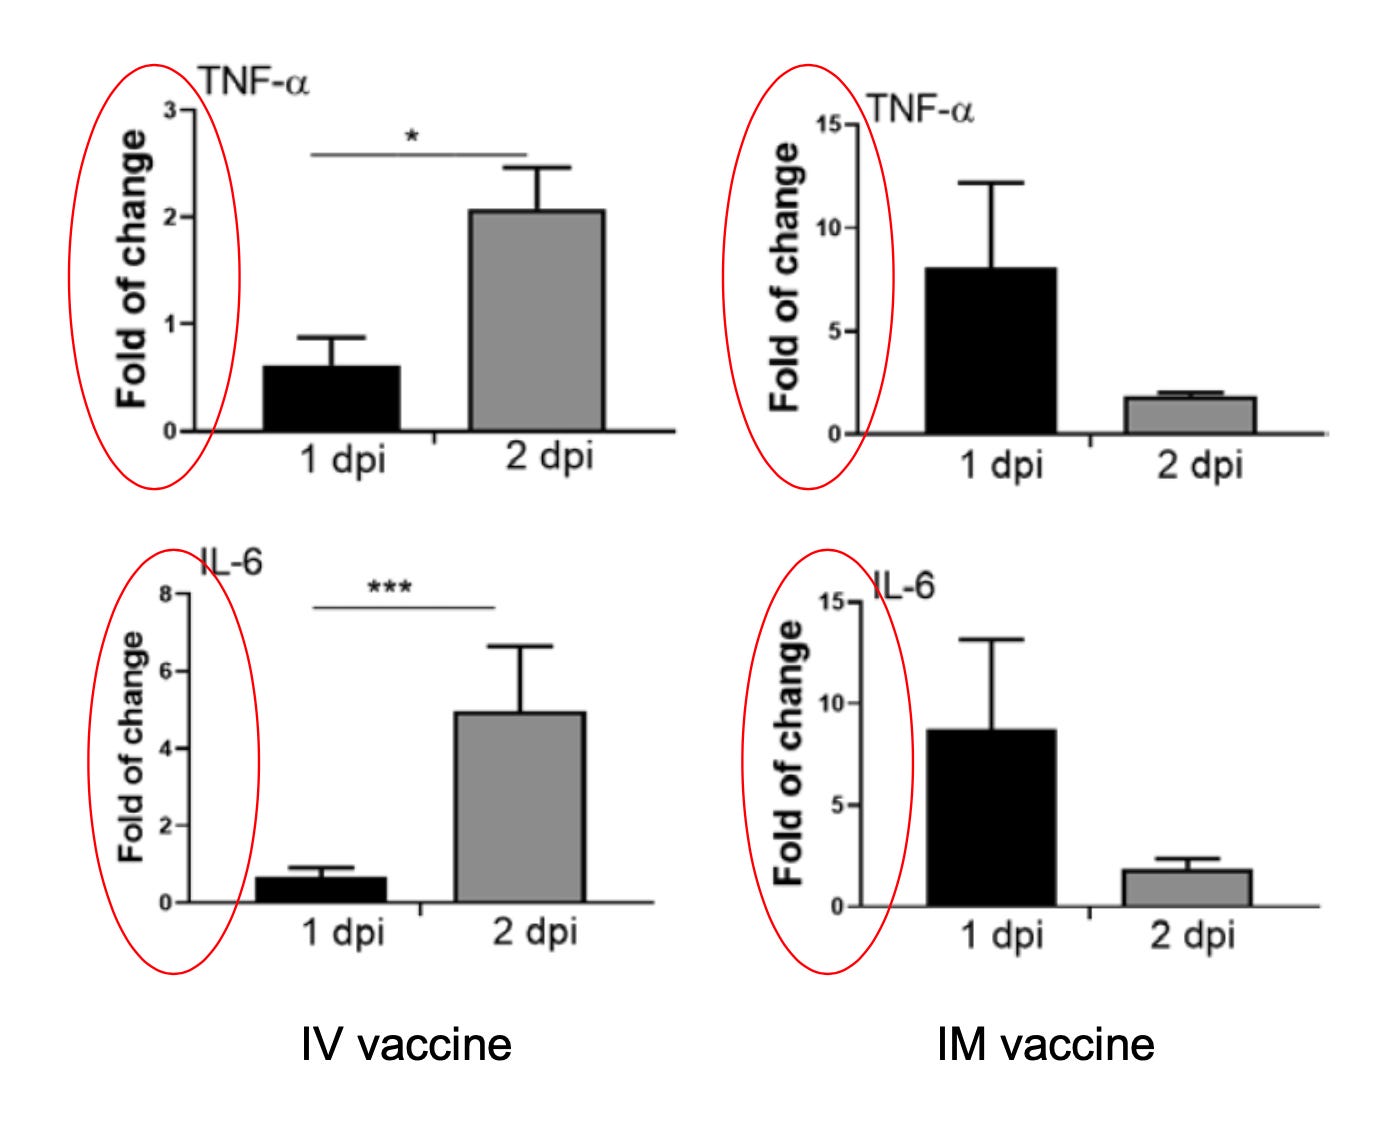
The scales were also different between the IV and IM groups. Here are just two (TNF-⍺ and IL-6) of the cytokine charts presented side by side:
The different scales might cause you to miss the fact that sometimes the fold changes in the IM group were not only higher at the 1 dpi time point compared to the IV group, but at the 2 dpi time point, they were sometimes about the same as the IV group. However, these results got summarized in the abstract as follows:
“Cardiac tissue mRNA expression of interleukin (IL)-1β, interferon (IFN)-β, IL-6, and tumor necrosis factor (TNF)-α increased significantly from 1 dpi to 2 dpi in the IV group but not the IM group”
Sigh. That’s the main takeaway?
Interestingly, when they measured actual cytokine levels (protein levels, not mRNA levels), sometimes these were higher in the IM group compared to the IV group (Fig 6). Very interesting.
Here’s another odd thing. Recall that the mRNA in these vaccines encodes for the spike protein, and when properly injected intramuscularly, they are supposed to get entirely taken up by muscle cells. Once inside muscle cells, the cells should produce spike protein using the newly introduced mRNA as “instructions.” This spike protein is supposed to then get presented on the surface of the muscle cells and eventually the body will produce neutralizing antibodies to it. This is what is supposed to happen when all goes well.
The researchers looked into whether the mRNA from the vaccines could transfect cardiomyocytes, which are cardiac muscle cells. In other words, they looked to see whether some of the mRNA vaccine got into the cardiomyocytes. That would be bad, because that would mean the cardiomyocytes could express spike protein and the spike protein is cytotoxic.
Here was their summary of the results:
“Using RT-qPCR, the amount of COVID-19 mRNA Spike-RBD gene copies was significantly higher in IV than IM group at 1 dpi. Although no statistically significant differences were found, the mean amount of Spike-RBD mRNA was higher in the IV group than the IM groups at all the other time points”
The chart for this was in the supplementary materials:
Just to nitpick for a sec: they used the β-actin gene as a normalizer here but that might not be a good idea.
Anyway, they said the amount of spike gene copies was significantly higher in the IV than IM group at 1 day post injection (dpi). But when I compare the two columns, I don’t really see much difference between them. Am I missing something here? I also don’t see much difference in the range. That’s a bit worrying, and none of this makes sense if your mental model is: “The spike protein stays where it’s supposed to after intramuscular (IM) injection.”
Remember, this is looking at spike mRNA in heart tissue. It’s not supposed to be there.
Spike protein and dosage
Let’s talk about dosages.
For both the IV and IM injected cases, the amount of mRNA in each dose given to the mice in this study was 0.25 µg per gram body weight.
Humans get 30 µg mRNA per dose if they’re getting this vaccine. If we use my mother as an example, who’s 84 lbs (yes, she’s tiny), we’d find that the mice got a dose that was 318 times as high as what my mother would get.
I realize that she is at the lower bound of weight for an adult, but I think it’s fair enough to use her as an example, because people like her are still given full adult doses of the vaccine.
Now, since the dose that the mice got was about 318 times as high as what any human would get, we wouldn’t expect to see the bad things happening to the mice of this study occur at the same rate as what we’d see in humans that get this vaccine.
That should give us some comfort, but let’s dig a bit.
If you get the Pfizer vaccine you’re supposed to get two doses. If we compare what the mice got in their first dose with the cumulative dosage my mother would get (60 µg), we’d see that what the mice got was 159 times as high as what my mother would cumulatively get.
Let’s also not forget that in some countries, they are giving out “booster doses,” based on zero studies; so some people would get a cumulative dose of 90 µg spread out over three doses. In this case the dose the mice are getting is 106 times as high as what my mother would get.
Now you might think it’s unfair to compare the cumulative dosage a person gets, spread out over multiple doses, compared to what the mice got in one dose. That’s fair enough; 90 µg spread out over 3 doses is different from 90 µg in one dose, and I would expect that the latter would lead to more adverse effects.
However, what we see from this study is that higher dosage leads to worse outcomes. So what we can say is that there seems to be a dose dependent relationship between the amount of vaccine and adverse effects, whether injected intramuscularly or intravenously. This is clear when you look at Table 1 and see that the adverse effects are consistently worse in the mice that got two doses, compared to those that got one.
The Moderna vax has an even higher amount of mRNA (100 µg per dose), so presumably we’d end up with higher amounts of spike protein than with Pfizer. It’s not easy to compare across the vaccines if you want to know how much spike protein each would produce (unfortunately none of this was studied), and I don’t think we can claim that there is a linear relationship between amount of mRNA and amount of spike produced across different vaccine platforms, especially considering that there were some differences in codon optimization between the platforms, which would affect the rate of mRNA translation.
However, we can still do napkin math: this reveals that the mice in this study got a dose that is about 95 times as high as what my mother would get with one dose of Moderna, and about 48 times as high as what my mother would get with two doses of Moderna.
Keep in mind that we don’t know whether a given amount of mRNA causes the same amount of spike protein to get produced across species. We also don’t know how much spike expression varies across individuals of the same species. It’s possible it could vary by orders of magnitude across individuals; we just don’t know, because it was not studied.
You can decide for yourself how comfortable you are with all that.
Curiously, there was no real speculation on the spike protein as the cause of the pathologies in the mice. Here’s what they do say, regarding spike protein:
“Here we showed that SARS-CoV-2 spike protein was occasionally expressed in cardiomyocytes 1 dpi of IV mRNA vaccine, although such expression was more often in the infiltrating immune cells in the myocardium and visceral pericardium. We have previously shown that the replication of SARS-CoV-1 leads to substantial accumulation of heavily modified transmembrane viral proteins such as unfolded spike at the endoplasmic reticulum, which rapidly exceed its folding capacity leading to stress and the unfolded protein response. When the damage to the endoplasmic reticulum is severe or persistent, the unfolded protein response triggers apoptosis”
This is not the same as speculating that the spike is cytotoxic, however.
When speculating about the causes of the various pathologies, the authors mention that some other vaccines have caused myocarditis before (notably the smallpox vaccine). They also speculate that a “possible causative mechanism of the mRNA vaccine induced myopericarditis could be the overly activation of cytokine production.” Implicit in this is that something in the vaccines would cause an overproduction of cytokines. Here’s what they have to say about that:
“Cardiac damage due to hypersensitivity toward other components of mRNA vaccine is unlikely as similar degree of damage should happen in both IV and IM groups.”
Again why not speculate that the spike protein itself could contribute to the damage? I’m surprised that they don’t, because there are several studies out now that show that the spike protein is cytotoxic.
How should we interpret WTH is going on?
The vast majority of people looking at this paper will probably only read the abstract. Sadly, even among scientists that will cite this paper in their own work, a good chunk of them will probably only read the abstract (of course I’ve never done that sort of thing).
Among those that do actually read the whole paper, I can’t help but wonder whether groupthink will influence their perceptions and prevent them from really questioning things.
I find this paper hard to categorize. We’ve probably all heard about fraud in scientific literature. We’ve heard of studies that have fabricated data.
But this paper isn’t like that. It contains some truly inconvenient data. If you were a researcher today, you wouldn’t want to make data like this up, because it goes against the “covid vaccines are extraordinarily safe and effective” narrative. Going against that narrative today, is bad for your career.
What we seem to have here instead, is a case where the data is in plain sight (well, some of it), but we’re told to not really believe it. I think this is what it looks like when politics or undue influence, creeps into science.
This is where I will speculate, but I’m imagining a scenario where the researchers were told that they needed to write out their discussion “carefully,” otherwise their paper wouldn’t get published. The other possibility is that there were conflicts of interest among the researchers, but then why would they conduct such a study in the first place?
There is this:
I actually don’t know how damning this is. Travel grants are usually not huge sums of money. But then again K.Y.Y is involved in vaccine development. K.Y.Y.’s name appears last on the author list for this paper; this usually means they are the head of the lab or group that the lead author is a part of. I’ll leave it up to intrepid journalists to look more into this.
For some reason this bothers me more than fabricated data. It implies that someone out there thought that they could get away with this obfuscation, because no one would question all the oddities. It implies that they were relying on some combination of laziness and groupthink to allow them to glide past the magnifying glasses.
What’s depressing is that it seems like it’s worked so far, based on the fact that this paper is not more of a scandal.
[UPDATE 11/27/21: More data on cardiac issues from the vaccines has been rolling in, here and here]
Spike from the vax vs virus: which is worse?
So you could categorize this paper as more evidence that the spike protein is bad news.
The question remains, when it comes to acquiring immunity, is it better to “get the spike” from the vaccine or the virus?
There are some who advocate getting the vaccine over acquiring natural immunity, no matter one’s age, sex, or pregnancy status. People who argue this will usually say that it’s safer to get the spike protein from the vaccines, or that we “get more spike” from infection, compared to the vaccines.
I’ll take that up in future posts.
You can subscribe or follow me here for updates.
[UPDATES 1/8/21: I mentioned earlier in this article that I reached out to the author about the number of mice they used in this study. I never did hear back.
There’s also now a wiki documenting “Orwellian Science” like this. It’s still a work in progress, but it will document papers that state opposite or disconnected conclusions from their data.]
Thanks to Wesley C. Smith (@wezuwezu) for contributing insights into the paper.


